 rizens
This article has been translated:
Chinese 1 (by Qlly)
Chinese 2 (by Qlly)
Korean (by Ykss)
I bet the need to tweak perfomance comes in a certain phase of development for every developer, in every app. There are very good resources and articles about how to tweak performance in react and this article is no exception. I thought I will share my conclusions and journey in reducing a performance bottleneck I went through from 0.5 seconds to 1.7ms as in Milliseconds.
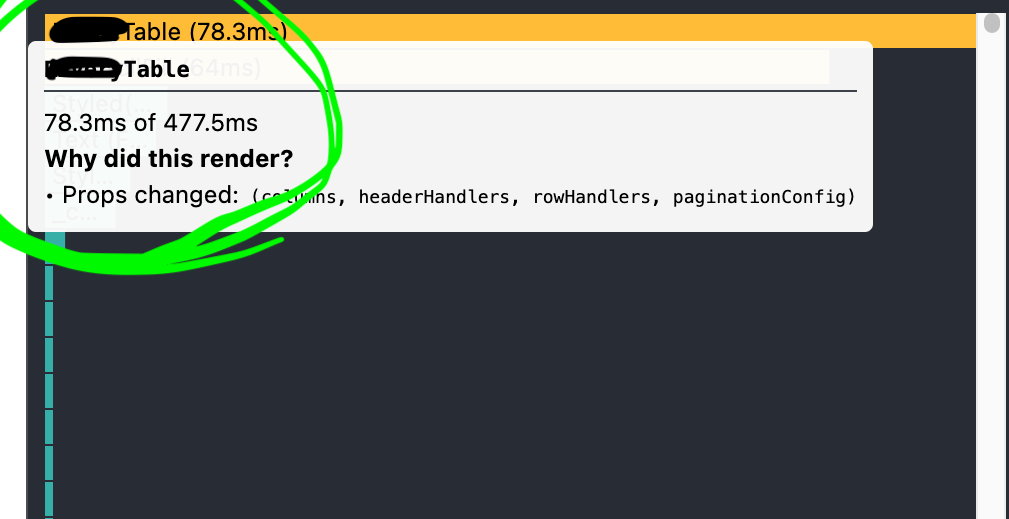
Before:
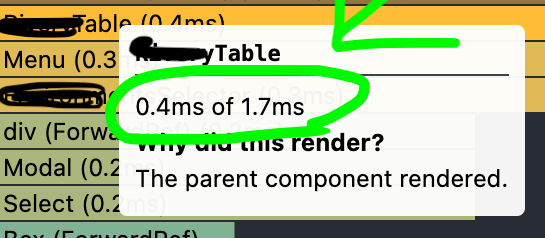
After:
I’m in favor of starting to tweak performance whenever you notice it. That means I don’t start using the usual useMemo() and React.memo() for each state in the app. There are some use cases where it’s not really needed - so my advise is - don’t “over-memoize”/optimize prematurley.
In the case I was working on, the UI felt really slugish - a wait time of 0.5 seconds is very noticable. The term ”First Meaningful Paint” also applies when it’s not the first one 🙂 - out attention span is usually low and to be honest - a sluggish UI tends to scare users away.
This performance journey includes:
Chakra-UI as the base ui libraryRedux Toolkit as state management layerreact-table v7 as the origin of the performance issueIn the use case I was working on, the table is a customized grid with few custom renderers for cells. The instance of the table is part of a parent component with other components. First render sometimes went well, however, when an update happend in a hook within the parent component or a state related to the parent component, the table would rerender - so one would definitley see sluggish UI that took 0.5 seconds to render. UX wise, you would see a certain freeze and then some movement in the UI. The table would even rerender when its data (columns and rows) didn’t change at all.
The hook in react-table doesn’t expose any UI - so - one must implment one according the docs.
Most examples demonstrate a non nested flat version of rather simple tables which work well.
The table component was composed of around +200 lines of nested and non nested jsx/components. Some of the non-nested jsx included a .map() iteration to render rows & table row headers.
At this point, it was obvious a refactor of breaking it down to smaller components has to be made. It was easy to spot some blocks of code that could be encapsulated into a wrapper component which also made sense to have, i.e: <TableHeader />, <TableRows /> etc.
This step made the table smaller and easier to read and reason about. One of the benefits of encapsulating few blocks to a component may reduce waste rerenders when the properties are primitive. This step alone, reduce the 0.5 seconds freeze in about 150ms. That’s great - but still, 350ms felt sluggish.
For components that did include non-primitive properties such as arrays, objects and functions, I had to look further down:
using React.memo did reduced rerenders, however, taking out static object properties from the render also helped:
const config = {
  headerHandlers: { isCustom: true },
  rowHandlers: { isCustomPadding: true },
  paginationConfig: {
    autoResetPage: false,
    autoResetGlobalFilter: false,
    initialState: { pageSize: 20 },
  },
};

<ReadMTable {...config} data={events} columns={eventColumns} />
For collection components - components that are using .map() to iterate through an array, I made sure each items is mapped to a component and gets a key as well. This means again using the benefit of no rerenders when a component includes primitive properties:
export const ReadMTableRows = React.memo(EventsTableRows);
export function EventsTableRows({
  rows,
  prepareRow,
  onClick,
  isRowDisabled,
}: TableRowsProps) {
  return rows.length > 0 ? (
    <>
      {rows.map(row => (
        <TableRow
          row={prepareRow(row)}
          key={`event-table-row-${row.id}`}
          onRowClick={onClick}
          disabled={isRowDisabled}
        />
        )
      )}
    </>
  ) : null;
}
By following the above pattern, the overall 0.5 seconds went down by 300ms. I was quite pleased, BUT I saw more room for improvement.
In this phase I noticed there were some constants that were pointing to a jsx code that used some properties of the table. Once again, to take the benefits of primitives with React’s component render life cycle, I converted those to components, i.e:
// BEFORE
const renderTableTitle = (title, totalRows) => {
  return (
    <Flex
      alignItems="center"
    >
      <Heading as="h4" fontWeight="bold">{title}</Heading>
      {totalRows}
    </Columns>
  );
}
// this is always invoked
{renderTableTitle('student statistics', page.length)}

// AFTER
function TableTitle ({ title, totalRows }) {
  return (
    <Flex
      alignItems="center"
    >
      <Heading as="h4" fontWeight="bold">{title}</Heading>
      {totalRows}
    </Flex>
  );
}
// this one rerenders when title (string) or page.length (number) - changes.
<TableTitle title={title} totalRows={page.length} />
It’s easy to see the component <TableTitle /> is rerendered when title or page.length change, both primitives. When used as a component, the app benefits from React’s component reconciliation lifecycle - as long as the props have the same value, the component isn’t rerendered. By Same Value, i’m referring to primitive values (number, string, boolean) or the same reference non-primitive (function, object) value (this can be achieved by serveral startegies: reference from a store, memoized value or a static reference).
This may be considered more performant, as the function invocation is always triggered and rebuilds the jsx.
In the scope of a table render cycle, when such a component is rendered for each cell, this strategy saves a lot of rerenders.
Although this title is a “clickbait”, I have found it funny enough to reflect how I feel when i’m trying to realize why component rerenders. Luckily enough, React’s devtool includes the Profiler tool.
Make sure the setting Record why each component rendered while profiling. is checked (click on the cog icon to display this dialog).
From now, in order to profile a suspicous non-performant scenario:

The profile then displays a flame/ranked chart (you can choose). Usually i’m looking for yellow bars and I start to look at the hints that answer the question “why did this render?” There are few helpful hints that may lead you to refactor or to rethink how the components are structured:
Now, the chase begins. In my table case, there were few helpful hints that made me realize I had to memo some of the returned data from the custom hooks I have created.

hovering the bars reveals the actual components in the dom - where it’s easy to reason whether that specific component should rerender. When it’s now suppose to render, it’s time to dig into the implementation and find what data is causing it to render through its props, hooks or any other source of data that is related to it.
When props include function callbacks, wrapping those with useCallback() may help to reduce render cycles.
There is no magic rule for finding the answer. Sometimes, a React.memo() would work - however - this requires trial and error only. To make it clear - i’m NOT promoing React.memo() for a solution. Usually, I prefer to dig further up the component tree - looking for any non-primitive objects that are recreated with the same data - in which case - I do prefer to useMemo() for that unless the store i’m using can do that.

When a bar’s tooltip indicates “hooks changed”, it’s time to jump into the component and carefully review the hooks associated with it.

To wrap up this journey, some performance bottle necks would be easy to spot and solve. Some might require an in depth journey up in react’s component tree as well as trial and error.
I believe performance profiling should take place when there’s a noticable slowdown in your application. The important concept is to make sure investigation is performed down to the root cause. Sometimes you may find that a change in architecture of how the jsx is composed should be changed - and if that’s the case - I encourage to think it through before adding any additional code that you would need to maintain.
if you have any questions or ideas on how to improve react peformance that you want me to write about - contact me or tweet me
Article is based on ReadM - a free app for practicing English reading fast while having fun.